In late 2020, Google Ads expanded the Report Editor to improve Auction Insight visualizations and reporting capabilities. We can now scatter plot competition in both Search and Shopping campaigns – while analyzing three unique metrics. Learn more about this new visualization feature and how it can help you present your PPC metrics more clearly.
3 Key Metrics: Shopping Impression Share, Outranking Share, and Overlap Rate
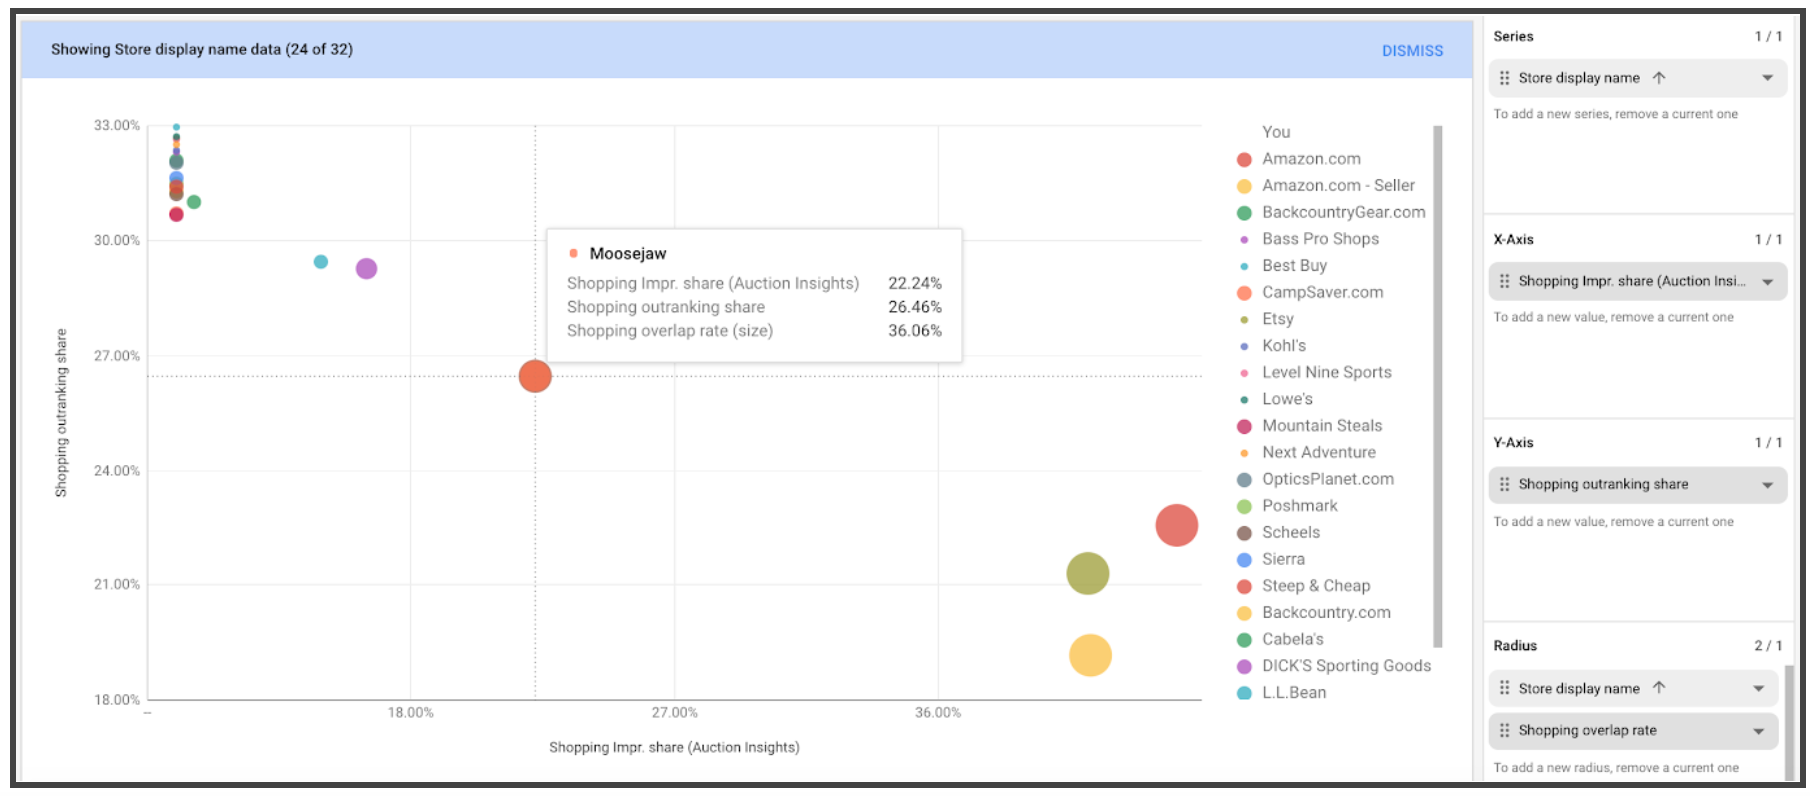
In the example below, we have charted the following:
- Shopping Impression Share: Impression share (IS) is the percentage of impressions that your ads receive compared to the total number of impressions that your ads could get.
- Shopping Outranking Share: “Outranking share” is how often your ad ranked higher in the auction than another advertiser’s ad, or if your ad showed when theirs did not.
- Shopping Overlap Rate: “Overlap rate” is how often another advertiser’s ad received an impression in the same auction that your ad also received an impression.
So, this scatter plot not only shows us who our competitors are – but also:
- How often we overlap (the size of the circle)
- How often we outrank them (bids and spend)
- Their overall impression share (how often they showed)
As an added feature, Google will show you the metrics when you hover over any given series on the plot.
Why Is This Auction Insight Report Noteworthy?
Having access to this data is not a new feature in Google ads. It’s purely a new way to visualize the competition for those that prefer to live outside of tables (excel/google sheet formats).
It also is a bit more intuitive for those that are not familiar with Auction Insight reports. Basically, it’s a quick and easy way to express competition for C-Level individuals, Owners, or non-PPC folk.
How Do You Create This Auction Insight Report?
When in Google Ads, do the following:
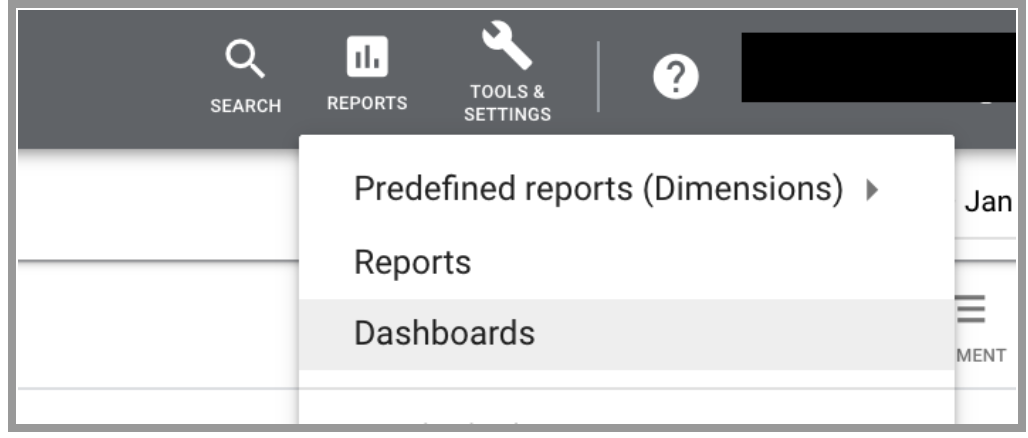
- In the top navigation bar, click on “reports” > “dashboards”
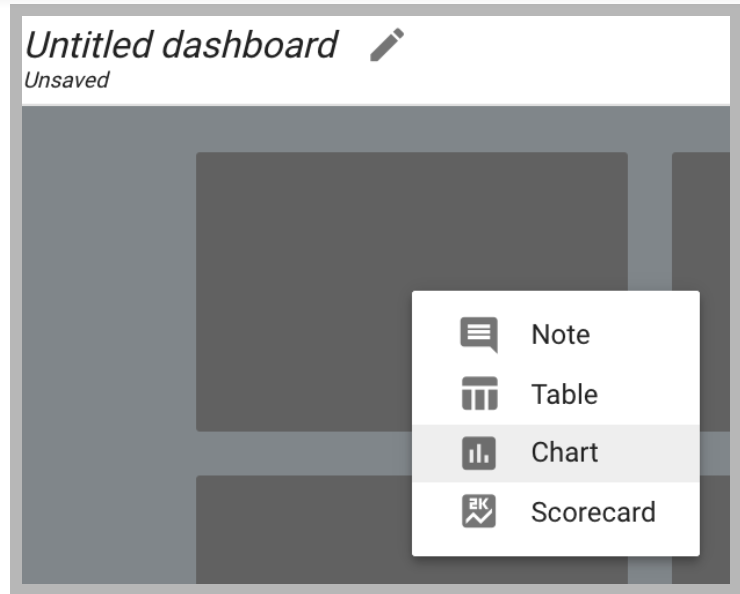
- Create a new dashboard as a “chart”
- In the screenshot we included earlier, we graphed out Auction Insight metrics for shopping campaigns. To do this, drag and drop the following metrics into the corresponding fields:
- X axis: Impression share
- Y axis: Outranking share
- Radius: Overlap rate
We highly recommend saving this report for future reference and to compare month-over-month metrics.
So I Created This Report, Now What Do I Use It For?
This report will not show you competitor spend levels. Tools such as SpyFu and SEMrush will give you estimates on spend, but they come with a huge margin of error.
Rather, this report should be used to give your marketing team a top-level view of the competitive landscape, and who is bidding on similar terms at similar levels. It will also tell you when domains enter and leave the auction – which can be used to set the tone for spend pushes to acquire larger Search Engine Result Page dominance.
Competitor tools like the 2 mentioned above will provide more insight into exactly what these competitors are bidding on, and what their ad copy looks like.
Need help managing your PPC? Reach out to WTM and see how our paid search specialists can optimize your campaigns.